Fractals
First posted: July 16, 2001
Last Modified: Sept 26, 2004
My original version of this web page relied on POV-Ray to draw little spheres, which were packed closely enough together to achieve pixel density. This approach required thousands of spheres, an external application, and was basically overkill -- although it was certainly doable and might still be a fine way to continue exploring the Python + POV-Ray dynamic duo.
My more recent demonstration of how to generate fractals uses the Python Imaging Library (PIL) by Fredrik Lundh, and available as free and open source from Pythonware / Secret Labs. The Image module allows your code to write pixel by pixel, by calling the putpixel method on your image, after which you may save your image in any of several graphical binary formats (e.g. JPG, PNG, BMP). The result is a higher resolution picture created in a more straightforward manner (than did my original approach). Experiment, have fun.
I've also made use of the Palette feature in PIL, meaning the image is first created as a 'P' type (P for palette), and then a palette of RGB values is fed in using the image's putpalette method. Each RGB value consists of 3 numbers, so the palette is just a list of 3 * 256 integers between 0 and 255. You have a lot of freedom as to how you want to color code, using the divergence rate as your index into the palette. My example uses the mod operator (%).
Fractals are not difficult to think about, mathematically speaking. The color or shade of gray used for any given pixel is determined by how fast a corresponding point on the complex plane diverges, when iterated through a simple function.
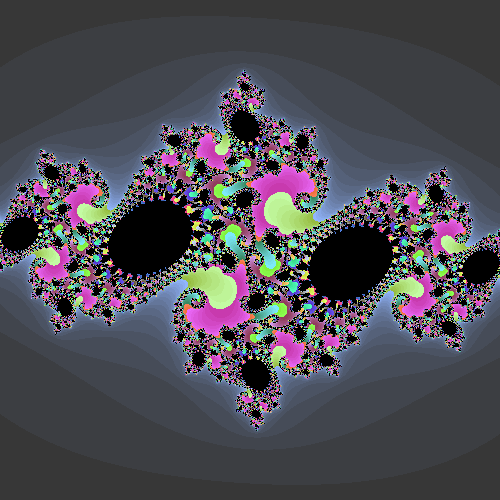
For Julia sets, the function is o = o**2 + z, where z is some fixed value, and o ranges through a rectangle of values (some part of the complex plane).
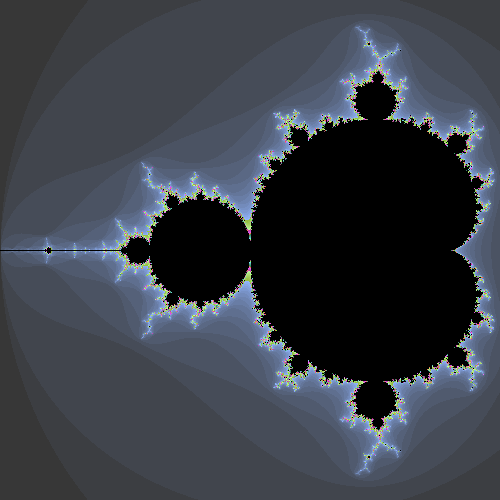
For the Mandelbrot set, o starts at a fixed point (typically (0,0), and z ranges through a rectangle of values.
Given everything else is the same, it makes sense to develop the Mandelbrot class as a subclass of the Julia (or vice versa, except that historically speaking, Julia sets were developed first).
Consider the Mandelbrot set. For most values of z around the edge of a bounding box of (-2.0, 1.25) and (0.5, -1.25), the function diverges quickly. And for values in a bug-shaped region around z=(0,0), the function converges. The fractal hallmark appears along the boundary between convergent and divergent regions. This border is infinitely complex: zooming in on it just yields more and more details.
For further reading:
- Colorized source code (and text format)
- Creating Palette Images with PIL
- Numeracy + Computer Literacy essay (explains povray, coords modules)
- Lorentz Attractor page (more simple source)
- More Plotting with PIL
